
Property Prices in Hackney
Source: HM Land Registry Price Paid Data, January–December 2025
What Your Budget Buys
Source: HM Land Registry.
Hackney flats average £583k — readers priced out at this level should also look at Brixton, the south-London creative peer that pitches a step below while keeping the same Zone 2 positioning.
What your budget buys in Hackney right now
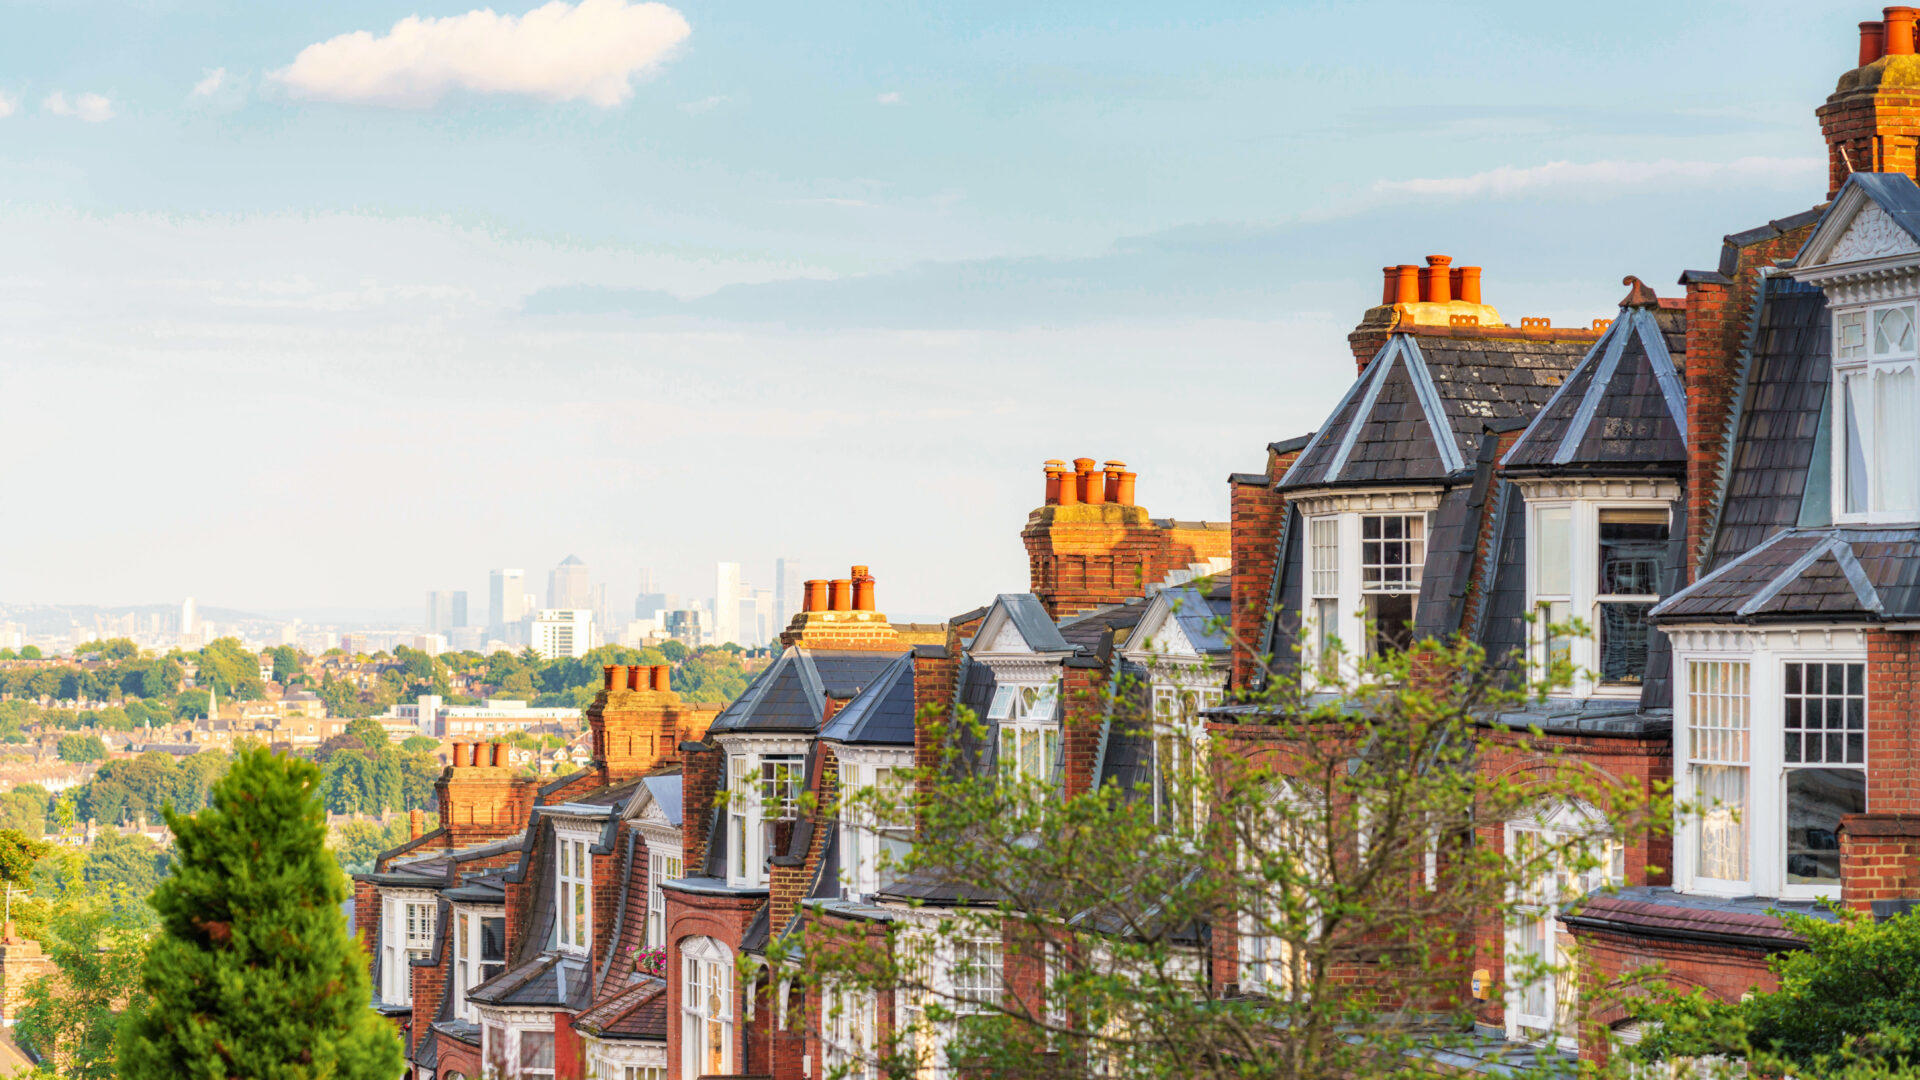
Hackney property prices are among the most closely watched in east London, reflecting the area’s cultural appeal and transport credentials. A one-bed flat in Hackney will set you back around £583k, putting you within reach of the quieter streets south of Dalston or the ex-council blocks east of Mare Street. Step up to a two-bed flat and you’re looking at roughly £600k — the borough-wide average for flats (Land Registry, 2025). That’s Zone 2 pricing, but with considerably more character than most Zone 2 alternatives. Understanding Hackney property prices is essential if you’re considering this neighbourhood; they’ve risen steadily over the past decade, reflecting consistent demand from buyers drawn to its unique position between City connectivity and independent culture.
Three-bed Victorian terraces are where the market heats up. The average terraced house price sits at £1.24m (Land Registry, 2025), though there’s a wide spread depending on whether you’re on a Conservation Area street near London Fields or a busier road off Kingsland High Street. Semi-detached houses average £1.4 million, and the handful of detached properties that come up trade at around £1.6 million — though with only a few sales per year, those figures shift with each transaction.
Of the 616 sales recorded in the past 12 months, 80% were flats. That tells you the market’s shape: this is overwhelmingly a flat-buyer’s borough, with houses commanding a steep premium when they appear (Land Registry, 2025).
Hackney vs Walthamstow, Peckham and Stratford: price comparison
| Property type | Hackney | Walthamstow | Peckham | Stratford |
|---|---|---|---|---|
| 2-bed flat (avg) | £600k | £420,000 | £452,000 | £430,000 |
| 3-bed terraced (avg) | £1.24m | £680,000 | £720,000 | £620,000 |
(Land Registry, 2025. Figures are annual averages.)
Hackney carries a 25–30% premium over the other three for comparable properties. The trade-off: you’re in Zone 2 with a food and cultural scene that none of the others quite match.
Leasehold vs freehold split and service charges
With 80% of sales being leasehold flats, service charges matter here. Typical annual service charges on a two-bed conversion flat run £1,500–£2,500, rising to £3,000–£4,500 on newer-build developments with lifts and concierge services. Ground rent on older leases can still be £250–£400 per year, though leasehold reform is gradually eliminating this for new builds. If you’re buying an ex-council flat, check the major works history — Hackney Council’s capital works programme has generated some eye-watering bills in recent years.
Rental yields and buy-to-let outlook
Average monthly rents sit at approximately £1,800–£2,200 for a two-bed flat, depending on condition and proximity to transport (Broadway Market, Dalston, and London Fields commands premiums; Mare Street periphery is cheaper). That puts gross yields in the 3.8–4.5% range — respectable for Zone 2, though below what you’d achieve further east (Stratford, Walthamstow hit 5–6%). The rental market is tight: vacancy rates are low and tenant demand consistently exceeds supply, particularly for well-maintained period conversions. A renovated two-bed conversion flat near London Fields will let within days; a studio on an upper floor near Mare Street may take 2–3 weeks.
Buy-to-let reality: Hackney’s investment case rests on location and lifestyle demand (food/culture scene), not capital appreciation. Year-on-year price growth is modest (3–5% annually). Yields of 4% are solid for Zone 2 but require careful underwriting (tenant mix, void history, maintenance costs, management fees). Professional investors often cite Hackney as “mature” — most obvious capital gains have occurred (2010–2022); current buyers pay for location, not discount value. New landlords should model conservatively on yield, not anticipate rapid price rises.
Schools in Hackney
🏫 Primary
🏛 Secondary
Gayhurst Community School
Kingsmead Primary School
London Fields Primary School
Mandeville Primary School
Morningside Primary School
Mossbourne Riverside Academy
Queensbridge Primary School
Sebright School
St John and St James CofE Primary School
St. Paul's With St. Michael's CofE Primary School
The Olive School, Hackney
Benthal Primary School
Berger Primary School
Daubeney Primary School
Gainsborough Primary School
Holy Trinity Church of England Primary School
Lauriston School
Mossbourne Parkside Academy
Nightingale Primary School
Northwold Primary School
Orchard Primary School
St John of Jerusalem Church of England Primary School
St Scholastica's Catholic Primary School
St. Dominic's Catholic Primary School
Mossbourne Community Academy
Mossbourne Victoria Park Academy
Haggerston School
The Bridge Academy
The City Academy, Hackney
The Urswick School - A Church of England Secondary School
Waterside Academy
Data: Ofsted, 1 March 2026
The headline numbers
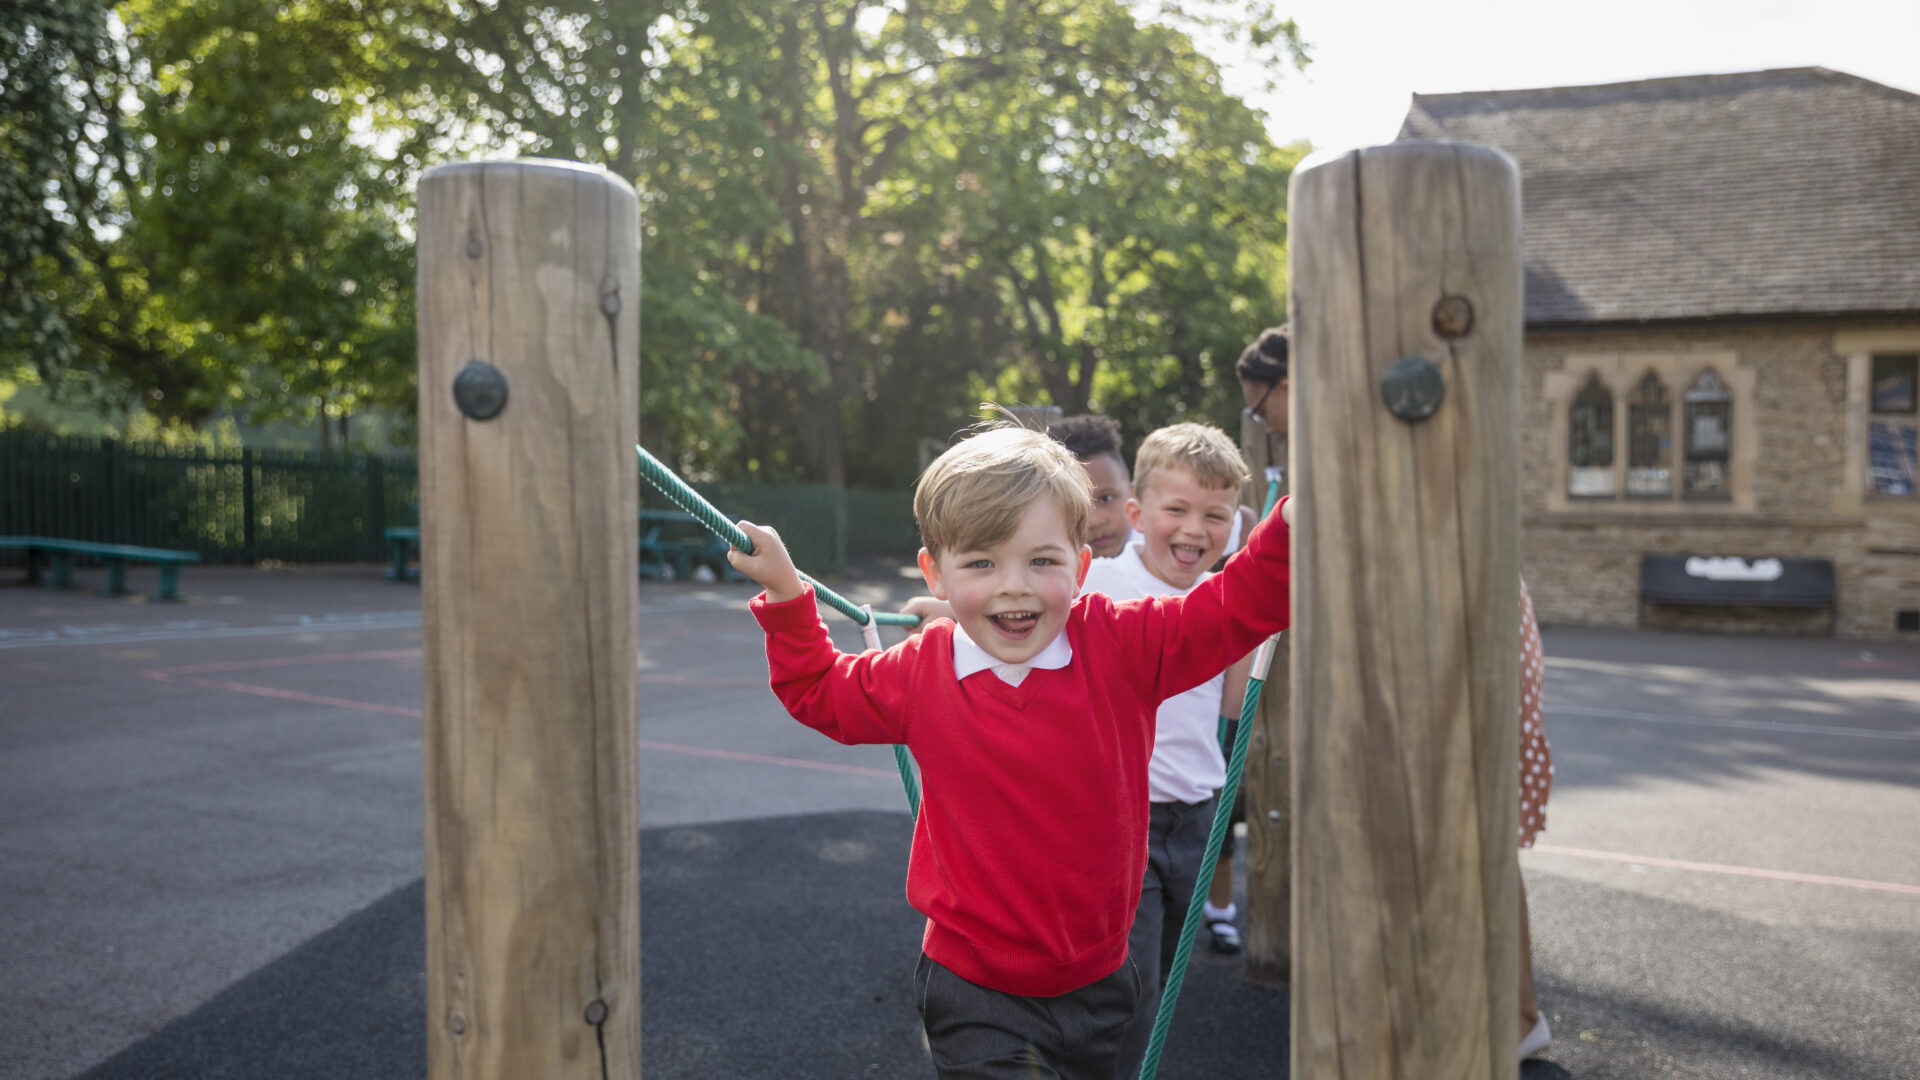
Hackney schools rank among the strongest in east London, with 28 state schools within reach — 18 primaries and 10 secondaries. The borough’s Ofsted profile is strong, with a notably high proportion of Outstanding and Good ratings across the board. For families considering the area, Hackney schools offer genuine quality: standout primaries include Gayhurst Community School (0.4 miles from the centre), Shacklewell Primary (0.5 miles), and Queensbridge Primary (0.7 miles), all rated Outstanding. The strength of Hackney schools provision is a major draw for young families moving to the borough, and schools consistently outperform London averages on attainment and progress measures.
Standout primaries with recent Ofsted grades (2023–2025): - Gayhurst Community School — Outstanding (Ofsted March 2025). Mixed community school; consistent top performer; strong leadership. - Shacklewell Primary — Outstanding (Ofsted February 2024). Community school; strong phonics/early reading; good pastoral care. - Queensbridge Primary — Outstanding (Ofsted January 2025). Community school; diverse pupil population; good value-added progress. - Fernbank Children’s Centre — Outstanding for early years (Ofsted March 2024).
Strong secondary options: - Hackney Learning Trust schools (mix of Good/Outstanding): managed secondary provision with broad curriculum. - Several Good-rated comprehensive secondaries serve the borough with standard GCSE/A-Level pathways.
Catchment reality: how far the Outstanding schools actually reach
Competition for places at the top-rated primaries is fierce. Hackney operates a distance-based admissions system (measured in a straight line from home to school). Gayhurst Community typically admits from within a 400–500 metre radius in oversubscribed years — roughly the streets between Mare Street and Queensbridge Road. Shacklewell’s catchment is similarly tight, drawing mainly from the streets between Shacklewell Lane and Rectory Road. Last-distance-offered data (published annually by Hackney Council) shows whether your postcode is within realistic reach.
The practical reality: if you’re buying specifically for a primary school place, contact Hackney School Admissions before committing to a property. Last-offer distances change annually based on application volume. Popular schools (Gayhurst, Shacklewell, Queensbridge) frequently exceed their capacity, and out-of-catchment families are routinely rejected. Secondary admissions are less distance-sensitive and more diverse in criteria — check individual school admissions policies.
Independent, faith and SEND provision
Beyond the state sector, Hackney is within reach of several independent options. The Lycée International de Londres (Wembley) and Yesodey Hatorah Senior Girls’ School reflect the borough’s diverse faith-based communities. For families with children who need specialist support, Ickburgh School on Kenninghall Road provides SEND (Special Educational Needs and Disabilities) specialist places, and the borough’s Educational Psychology Service is regarded as responsive by parent forums. Mainstream schools also have inclusive provision for children with identified SEN.
Nurseries and early years
Hackney has a strong network of maintained nursery schools, including Fernbank Children’s Centre (Outstanding, Ofsted March 2024) and Woodberry Down Children’s Centre. The borough also has a higher-than-average number of childminder places per capita (Hackney Council, 2025). For Stay & Play sessions, Hackney Ark on Morning Lane runs drop-ins on weekdays. Universal Free Childcare entitlements (15 and 30 hours) are available through private and maintained providers; childcare costs are moderate by Inner London standards (approximately £800–£1,100/month for full-time care).
Hackney's Outstanding-rated provision runs deeper than most London boroughs' — families also comparing strong east-side options should look at Walthamstow, whose school landscape matches on pool size and the Ofsted-Good spread.
Transport & Commute: Hackney
Commute Times
Source: TfL Journey Planner, 2026. All times are station-to-station (boarding to alighting); add 5–10 minutes for walking to your nearest station and waiting.
Hackney's Central line and Overground connections run directly into Stratford, making the east-London commute corridor one of the most flexible in the city — a single hop between two of its biggest neighbourhoods.
Commute times to 8 key destinations
| Destination | Route | Journey time |
|---|---|---|
| Bank / City | Overground → Liverpool St, then Central Line | 29 min |
| Canary Wharf | Overground to Shadwell, then DLR | 33 min |
| King’s Cross | Overground to Highbury & Islington, then Victoria Line | 29 min |
| Victoria | Overground to Highbury & Islington, then Victoria Line | 38 min |
| Liverpool Street | Overground direct from Hackney Central | 15 min |
| London Bridge | Overground to Whitechapel, then Northern Line | 28 min |
| Paddington | Overground to Stratford, then Elizabeth Line | 35 min |
| Stratford | Overground direct from Hackney Central | 10 min |
(TfL Journey Planner, April 2026. Peak times, door-to-platform.)
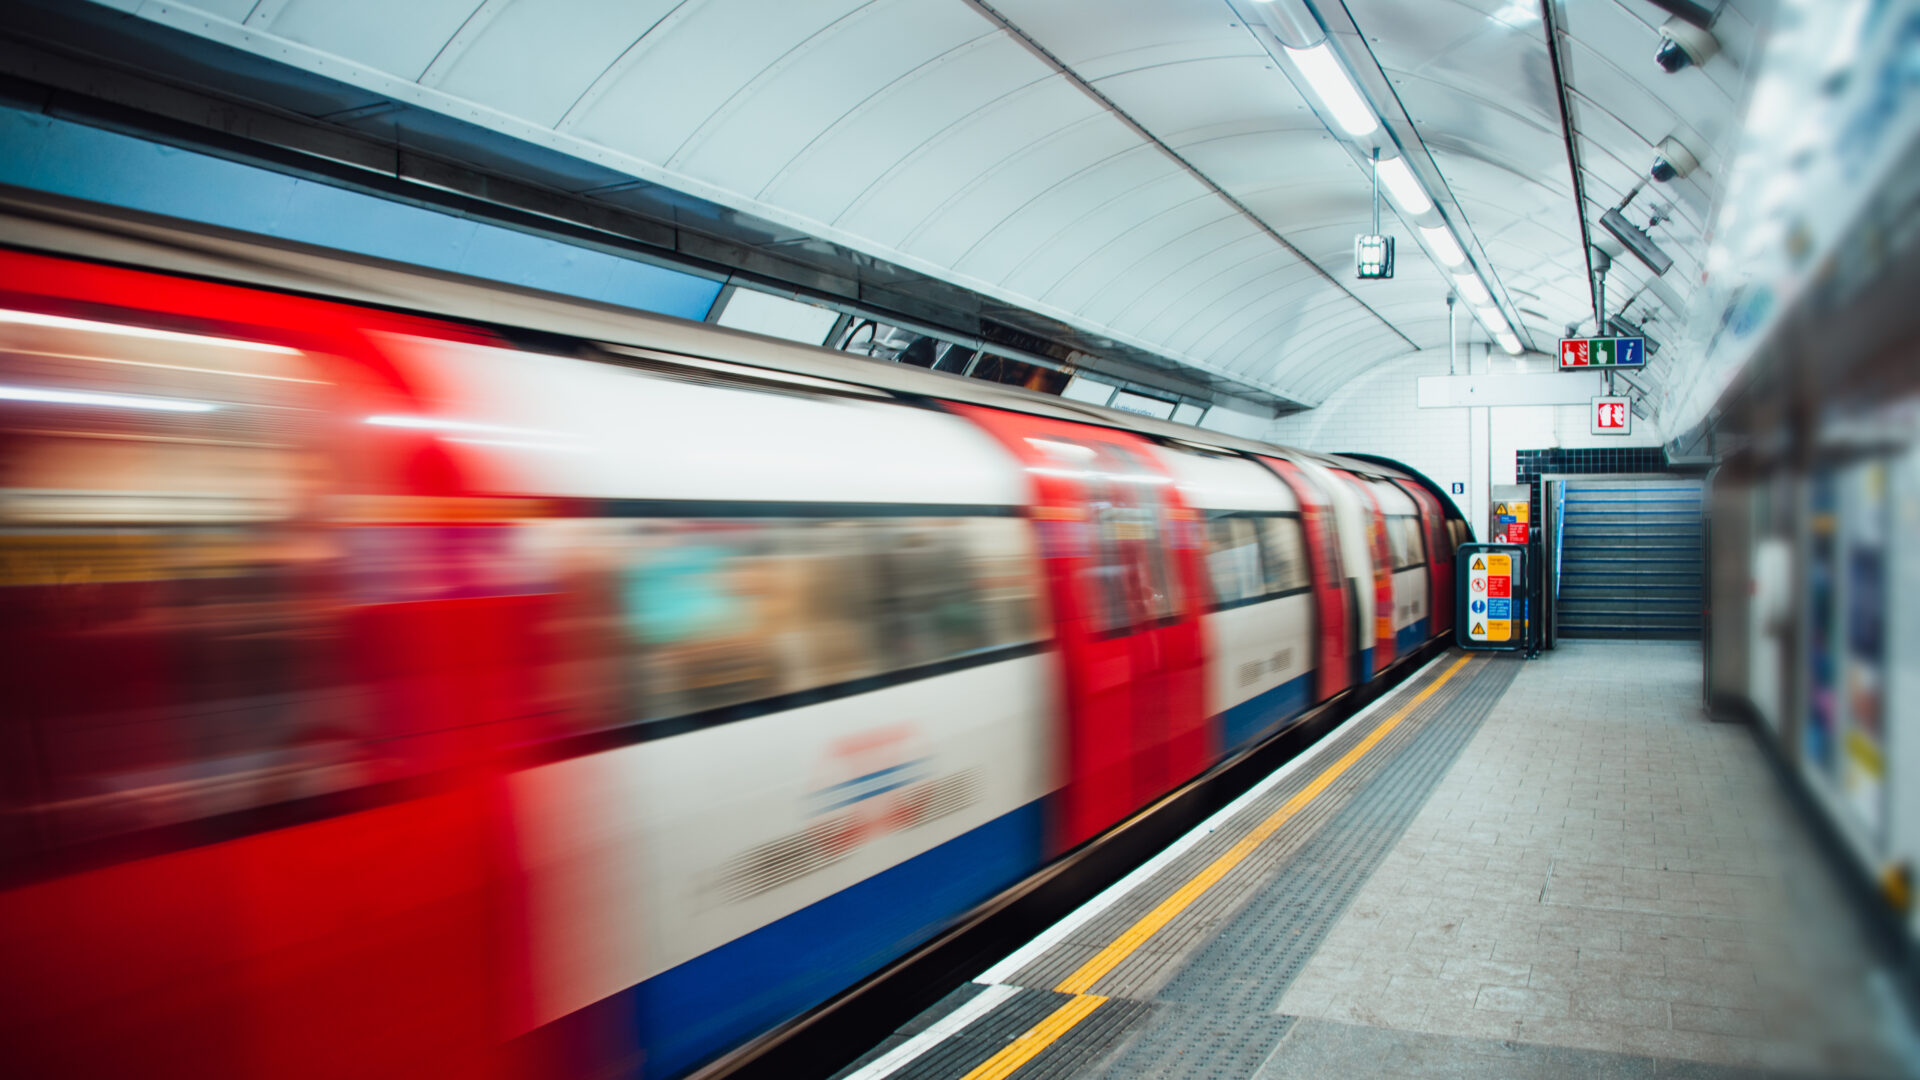
Hackney transport is built on the Overground network, with the standout being Liverpool Street in just 15 minutes on the Overground from Hackney Central. If you work in the City, this is one of the shortest Zone 2 commutes in London. For most residents, Hackney transport connectivity to central London is among the key advantages of living in the area.
The station setup
Hackney has no Underground station — a fact that surprises most people. Your primary stations are Hackney Central and Hackney Downs, both on the London Overground. Hackney Downs also has National Rail services. The nearest Tube is Bethnal Green on the Central Line, 1.1 miles south — a 20-minute walk or a quick bus ride on the 106 or 254.
This lack of Tube access is the single biggest transport caveat. It means you’re reliant on the Overground network, which runs less frequently than the Tube (every 5–10 minutes at peak, 10–15 off-peak) and doesn’t run 24 hours. If you work shifts or regularly travel late, factor this in.
Weekend, night and off-peak service
No Night Tube — the Overground doesn’t run a night service. The last train from Liverpool Street to Hackney Central departs around 23:30 on weekdays, 00:30 on Saturdays. Night buses N38, N55, N242, N253 and N277 cover the area, but expect 20–30 minute waits after midnight. Uber and Bolt are the practical late-night fallback.
Weekend Overground services run every 10–15 minutes but are subject to more frequent planned engineering closures than the Tube, particularly on Sundays.
Walking, cycling and active travel
Hackney is one of London’s most cycleable boroughs. The cycle ride to Bank takes just 18 minutes via the Cycleway network (3.3 miles). CS1 runs through the borough, and there’s extensive cycle lane infrastructure along Mare Street and Dalston Lane. TfL cycle parking at both Overground stations. If you’re a cyclist, Hackney works exceptionally well.
Walking is equally practical within the borough — Broadway Market, London Fields, Mare Street and Dalston are all within a 20-minute walk of each other. The canal towpath from Broadway Market to Victoria Park is a flat, traffic-free route that locals use daily.
Driving, parking and the CPZ reality
Hackney has one of London’s tightest Controlled Parking Zone (CPZ) networks — almost every residential street is covered. The good news: resident permits are remarkably cheap at £98 per year (emissions-based, Hackney Council, 2025/26). The bad news: available bays are scarce, particularly around Mare Street and Dalston. Visitor vouchers are available but limited. If you own a car, you’ll park it — but you might not park it outside your front door.
The entire borough sits within the Ultra Low Emission Zone (ULEZ). All petrol cars from 2006 and diesel from 2015 are compliant.
Accessibility and step-free access
Neither Hackney Central nor Hackney Downs is step-free. The nearest step-free station is Dalston Junction (Overground), 0.6 miles north of Hackney Central. For wheelchair users and those with buggies, this is a meaningful limitation — plan your route to include Dalston Junction or use the bus network, which is fully wheelchair-accessible.
Crime & Safety in Hackney
Top Concern
Source: Metropolitan Police via data.police.uk · Population: ONS Census 2021 · Updated monthly
Crime trend: last 12 months
Is Hackney safe? The headline: Hackney records 193 crimes per 1,000 residents — among the highest in London. Metropolitan Police data (January 2026) shows an overall crime rate of 151.6 per 1,000 residents, well above the London average of 129 per 1,000. Hackney consistently ranks in the top 5 most crime-affected boroughs in London. However, context matters: this reflects the high density, active nightlife, and substantial student population. Year-on-year trends show variations by category (see below), but the borough maintains dedicated Safer Neighbourhood Teams with ward officers across Hackney Central, Hackney Downs and Dalston wards.
What gets reported: top 3 categories
The most commonly reported crime types in Hackney are:
- Violence and Sexual Offences: 8,702 offences during 2025, giving a rate of 27 per 1,000 residents (the highest category by count). This includes street assault, late-night economy violence, and domestic abuse.
- Theft From the Person: 4,259 offences during the 12-month period ending January 2026, a rate of 13 per 1,000 — notably 8 times the national average. This category includes phone snatching, bike theft, and bag theft in busy areas.
- Theft (Other): Shoplifting, vehicle theft, and other theft-related offences. Common in commercial areas around Broadway Market and Mare Street.
Most crimes cluster in these categories; serious organised crime and homicide are statistically rarer.
Safer pockets vs busier pockets
When evaluating whether Hackney is safe for your lifestyle, geographical variation is crucial. Dalston and the stretch of Kingsland High Street between Dalston Junction and Hackney Downs see the highest concentration of reported incidents, particularly on weekend evenings. The active nightlife (bars, late-night food vendors, club culture) correlates with violence, theft and antisocial behaviour. Queens Road and the streets immediately around Hackney Downs station also see higher crime concentrations during evening hours.
By contrast, the quieter residential streets around Clapton Square, London Fields’ western edge and the De Beauvoir Town pocket bordering Islington consistently record lower crime rates. These Conservation Area streets benefit from lower throughput, fewer late-night venues, and closer-knit communities. Resident forums confirm this pattern — Mumsnet threads from 2025 note that “the better streets create a little bubble” while recommending “common sense safety precautions” around the busier commercial strips.
Safety in context
Hackney’s crime rate (151.6 per 1,000) sits well above the London average (129 per 1,000), which is consistent with an inner-city Zone 2 borough with:
– High population density (17,239 people per sq km)
– Active nightlife and late-night economy (restaurants, bars, clubs concentrated in Dalston)
– Substantial student population (Hackney is younger and more transient than many boroughs)
– High retail footfall on Mare Street and Broadway Market
The pattern matters more than the headline figure. Most crime is theft or night-time assault related to the active nightlife. Daytime safety on main streets is generally fine. Late-night safety, particularly on Dalston and Kingsland Road Friday/Saturday after midnight, requires standard urban awareness — don’t walk alone, keep valuables hidden, avoid obvious targets.
Council-funded CCTV coverage along Mare Street and Kingsland Road was expanded in 2024. The Safer Neighbourhood Team maintains visible presence, particularly weekend evenings (Metropolitan Police, 2025).
Unlock the Complete Hackney Guide
You’ve seen the headline data. Get the full picture — detailed narratives, council costs, community character, and our editorial verdict.
- 🎓 In-depth school, transport & crime analysis
- 🏛 Council tax & parking costs
- 🏘 Community character & local vibe
- ⭐ Editorial verdict, value assessment & future outlook
- 📦 Moving practicalities
By unlocking, you’re happy for us to email you this guide plus the occasional helpful update from Property Around London. No spam — unsubscribe anytime.
Council Fees in Hackney
Council Tax (Annual)
| Band C | Band D | Band E |
|---|---|---|
| £1,748 | £1,966 | £2,403 |
Parking
Source: London Borough of , 2026
Council tax bands A–H (2025/26)
| Band | Annual charge |
|---|---|
| A | £1,311 |
| B | £1,529 |
| C | £1,748 |
| D | £1,966 |
| E | £2,403 |
| F | £2,840 |
| G | £3,277 |
| H | £3,932 |
(London Borough of Hackney, 2025/26)
Band D at £1,966 is £212 below the Outer London average — one of the more affordable councils for a Zone 2 borough. Most two-bed flats fall in Bands B–C; most terraced houses in Bands C–D (£1,966/year for Band D).
Bin days, recycling and garden waste
Hackney operates fortnightly general waste collection and weekly recycling. You’ll get a grey bin for general waste, a green bin for mixed recycling (paper, card, cans, glass, plastics), and a small food caddy for weekly food waste collection. Garden waste is a separate opt-in service at £70 per year for a fortnightly brown bin collection, April to November. The council’s recycling rate sits slightly below the London average — a pressure point in local politics.
Parking permits and the visitor scheme
Annual resident parking permits cost just £98 (emissions-based, increasing for higher-emission vehicles). That’s genuinely cheap for Zone 2. Second permits are available but cost more. Visitor vouchers: you get a book of 25 one-day vouchers for £26.25 — again, reasonable. Apply online through Hackney Council’s portal; expect a 5–10 working day turnaround for new permits.
Planning, Article 4 and extensions
Hackney has extensive Conservation Areas covering De Beauvoir Town, Clapton Square, Mare Street, and parts of Stoke Newington. If your target property sits in one of these, permitted development rights may be restricted — meaning even minor external changes (replacement windows, satellite dishes) need planning consent. The borough also has Article 4 Directions limiting conversion of family homes to Houses in Multiple Occupation (HMOs). If you’re planning a loft extension, budget for a full planning application rather than relying on permitted development.
Hackney Community Character
Hackney's independent food-and-music density finds its south-London mirror in Peckham, where the Rye Lane scene does the same job on the other side of the river and the two high streets read as siblings rather than rivals.
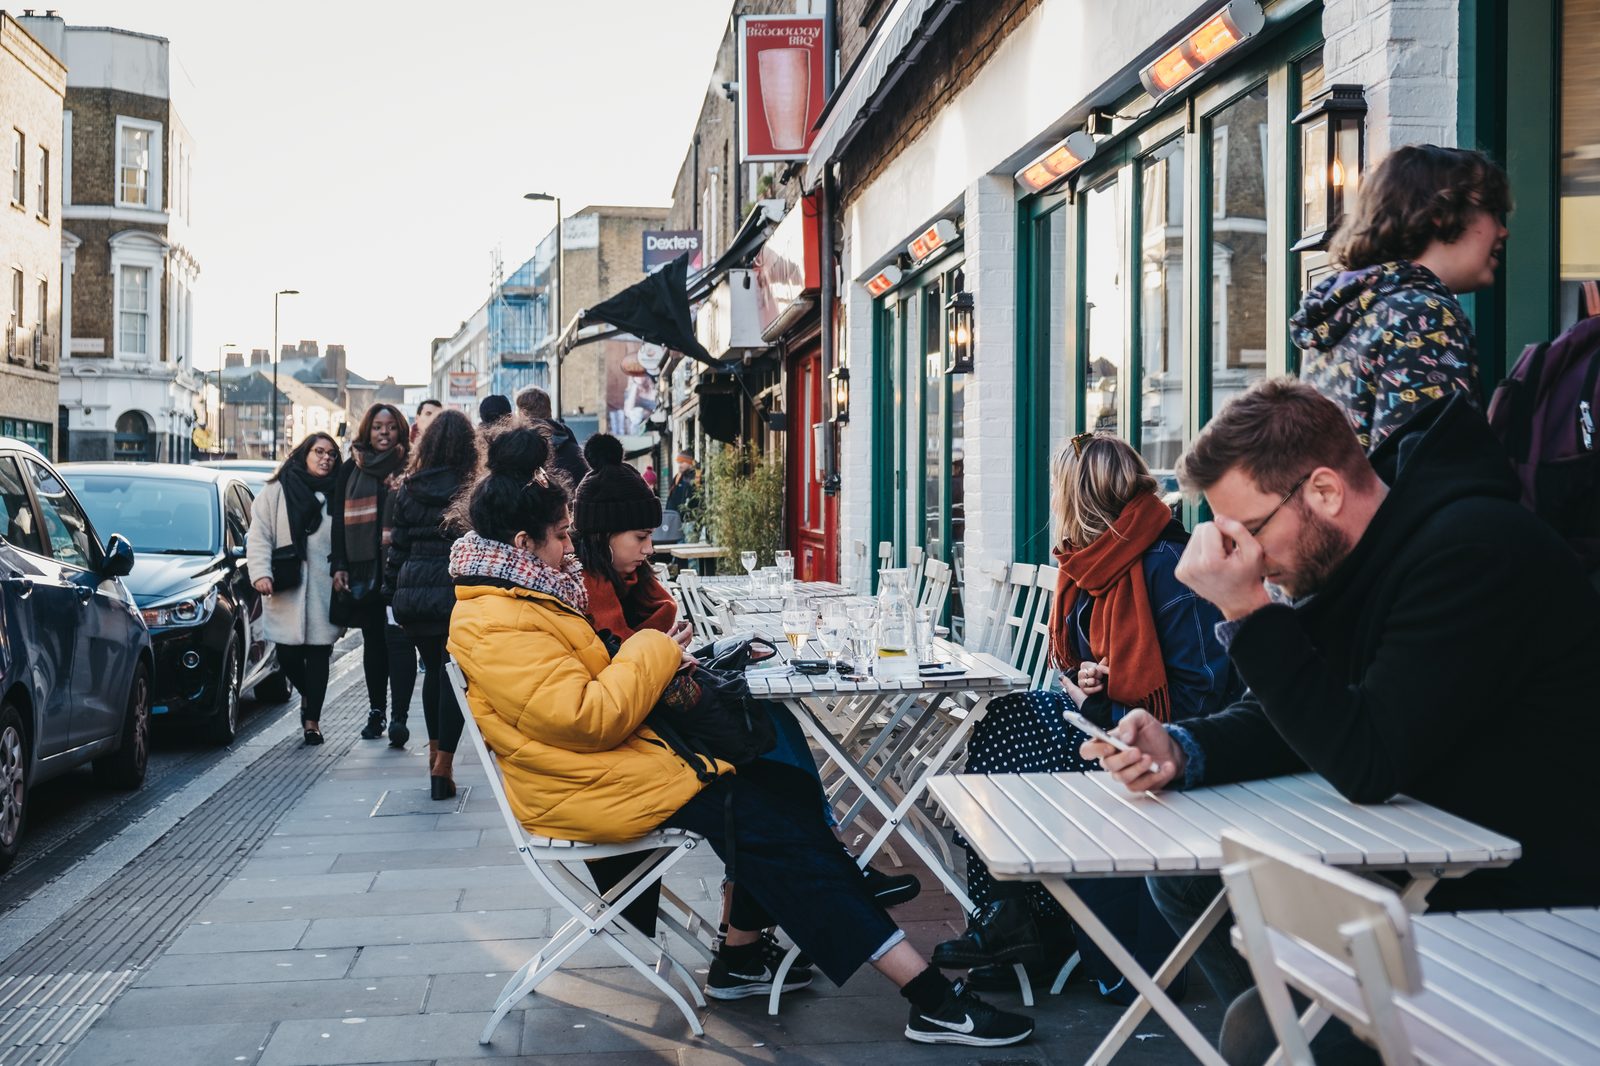
A Saturday morning in Hackney
Start at Hackney Central and walk east along Mare Street. By 10am the independent coffee shops are full — pavement tables spilling onto the kerb outside the cafés near the Town Hall. Turn right onto Broadway Market and the character shifts. Over 100 stalls line the street every Saturday from 9am: sourdough from E5 Bakehouse, Ethiopian street food, Thai curries, stacks of vintage vinyl. The smell of wood-fired flatbreads drifts across from a stall halfway down. The crowd is local — parents with pushchairs, couples carrying tote bags of vegetables, a few dogs tied to railings outside the cheese counter.
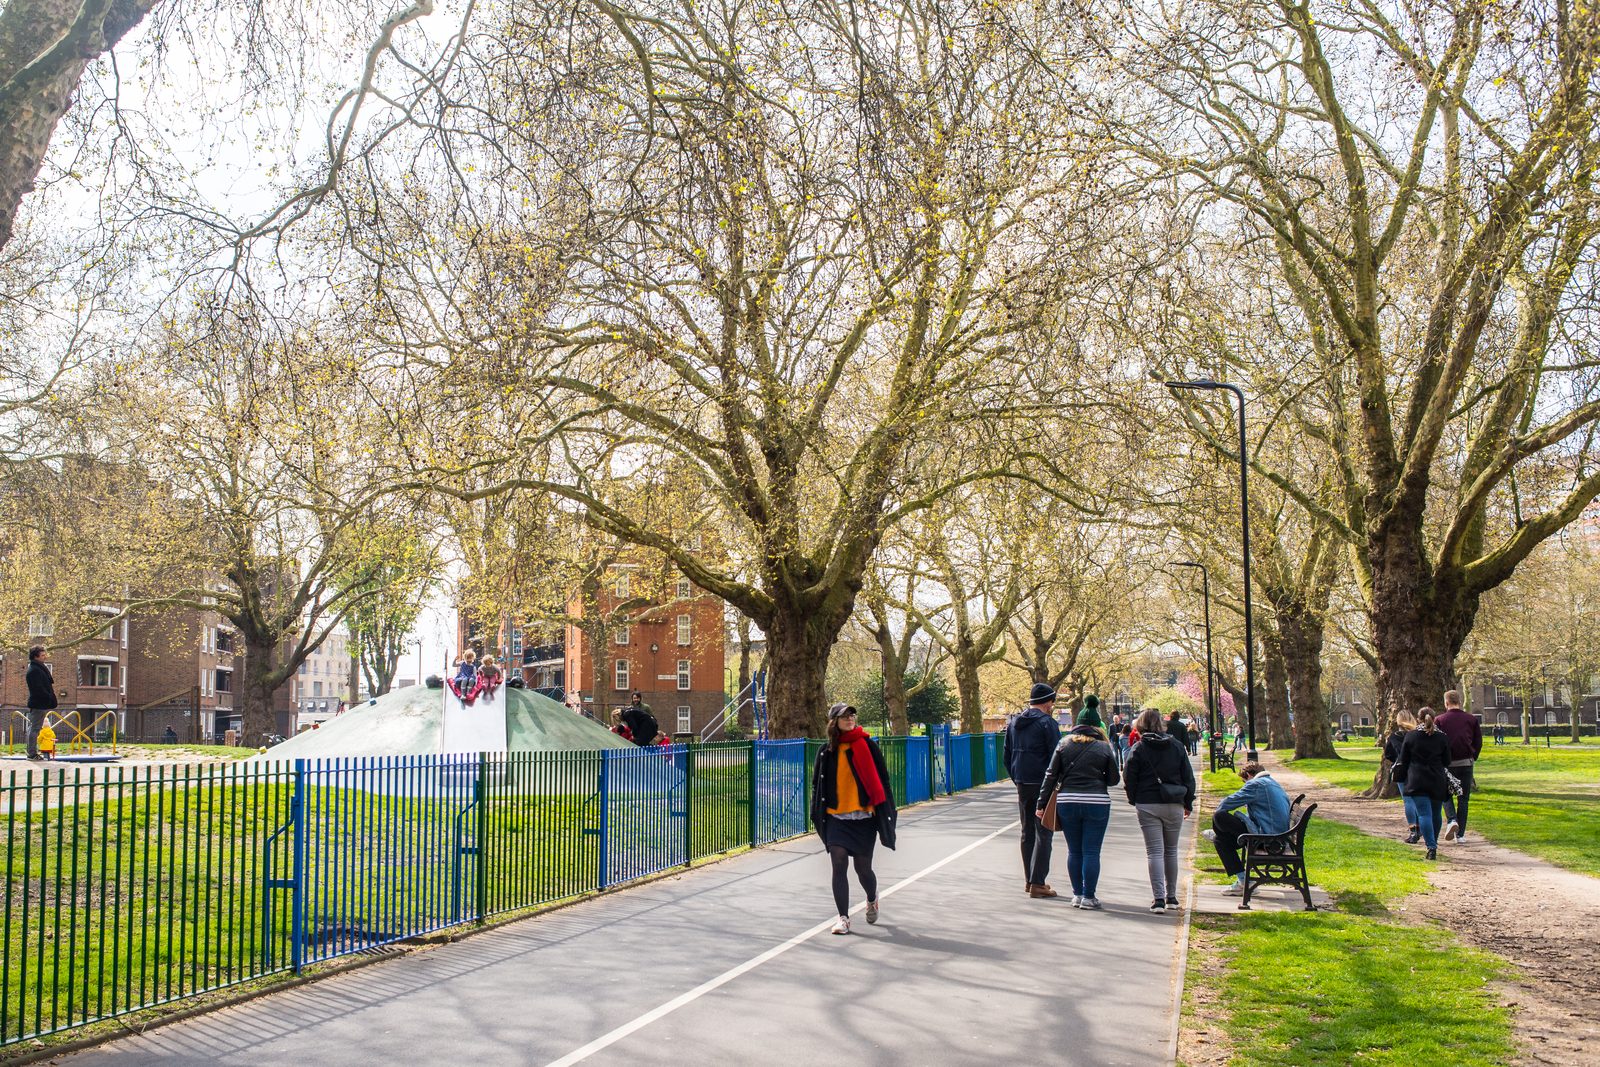
At the southern end, the market spills into London Fields. By 11am the park is filling up — runners doing laps, a cricket game assembling on the far pitch, the Lido queue building along the pavement. The heated 50-metre outdoor pool stays at 25°C year-round (Better, 2026), but in good weather the queue can run 20 minutes deep by midday.
Walk back via the Regent’s Canal towpath and you’re in a different borough — narrowboats, towpath cyclists, the quiet hum of Hackney Wick’s studio buildings visible across the water.
After dark
Hackney’s evening scene splits sharply by geography. Dalston is where the energy concentrates — Kingsland Road and its side streets host everything from the Ridley Road Market Bar (DJs, cheap drinks, free entry midweek) to Doña on Stoke Newington High Street (mezcal bar with basement cabaret and drag nights). Three Sheets on Kingsland Road does precise, understated cocktails in a room barely wider than a corridor.
Head a mile north to Stoke Newington Church Street and the pace drops. This is pub-and-wine-bar territory: The Londesborough for a Sunday roast and a sofa by the fire, or dan’s for natural wine by the glass in a room that seats about fifteen.
The honest picture: Mare Street itself quiets down noticeably after 9pm. The nightlife concentrates in the Dalston strip and doesn’t spread far. If you live south of London Fields, your Friday night options within walking distance are more limited than the borough’s reputation suggests. Resident forums are consistent on this — several Mumsnet threads from 2025 describe the contrast between “Dalston’s buzz” and the residential quiet a few streets away.
Five places locals actually use
E5 Bakehouse (Arch 395, Mentmore Terrace) — opened in a railway arch in 2011, now spanning three arches with its own flour mill and pastry department. Named one of the UK’s 50 best bakeries (Good Food Guide, 2026). The sourdough loaves sell out by noon on Saturdays. A third location opened at V&A East Storehouse in Hackney Wick in May 2025.
Mangal 2 (4 Stoke Newington Road) — a family-run Turkish restaurant that’s quietly reinvented itself. Ali Dirik opened the original Mangal in 1987; sons Ferhat and Sertaç now run the kitchen with an ingredient-led, small-plates approach that’s won attention from the National Restaurant Awards. Still does a proper kebab, but the menu has moved far beyond it.
Brat x Climpson’s Arch (Climpson’s Arch, Hackney Central) — Tomos Parry’s Michelin-starred operation, cooking over coal in a railway arch with a courtyard where you can hear the trains overhead. Basque-influenced whole turbot and wood-roasted vegetables. One Michelin star (MICHELIN Guide, 2026). Not a casual weeknight spot — book well ahead.
Sager + Wilde (193 Hackney Road) — a wine bar in the shell of the old British Lion pub, open since 2013. The list changes daily, leaning towards natural and organic producers. The grilled cheese sandwich is oddly famous. Locals treat it as a neighbourhood pub with better bottles.
London Fields Lido (London Fields West Side) — the 50-metre heated outdoor pool is an institution. Open year-round, heated to 25°C, and free with a Hackney library card (Better, 2026). In summer, the terrace fills with swimmers drying off in the sun. In January, you’ll share the lanes with a handful of devoted regulars. It’s one of the few genuinely free world-class amenities left in inner London.
Hackney through the seasons
Spring: The Regent’s Canal towpath between Broadway Market and Victoria Park comes alive — narrowboat gardens bloom, towpath runners multiply, and London Fields Lido starts to queue. The HOKA Hackney Half Marathon in May sends 20,000+ runners through Mare Street and Broadway Market, selling out in two days (Hackney Moves, 2026).
Summer: London Fields becomes Hackney’s communal garden — barbecues on the south side, cricket on the pitches, the Lido packed from opening. Broadway Market extends its hours and the canal towpath stays busy until dusk.
Autumn: Victoria Park is the place to be. The tree-lined walks transform into corridors of copper and gold — locals call it one of the finest autumn displays in east London. Broadway Market shifts to warmer stalls: mulled cider, game pies, seasonal squash.
Winter: Broadway Market adds Wednesday evening sessions through December (noon–7pm), with a Santa’s grotto, handmade gift stalls and festive lights. The Lido stays open but the crowds thin — winter swimming here feels like a well-kept secret, the steam rising off the 25°C water into the cold morning air.
Source: Google Maps, OS Open Greenspace & editorial research, 2026
Victoria Park, Broadway Market, 11 Outstanding primaries — Hackney pairs east London's creative depth with Zone 2 prices to match.
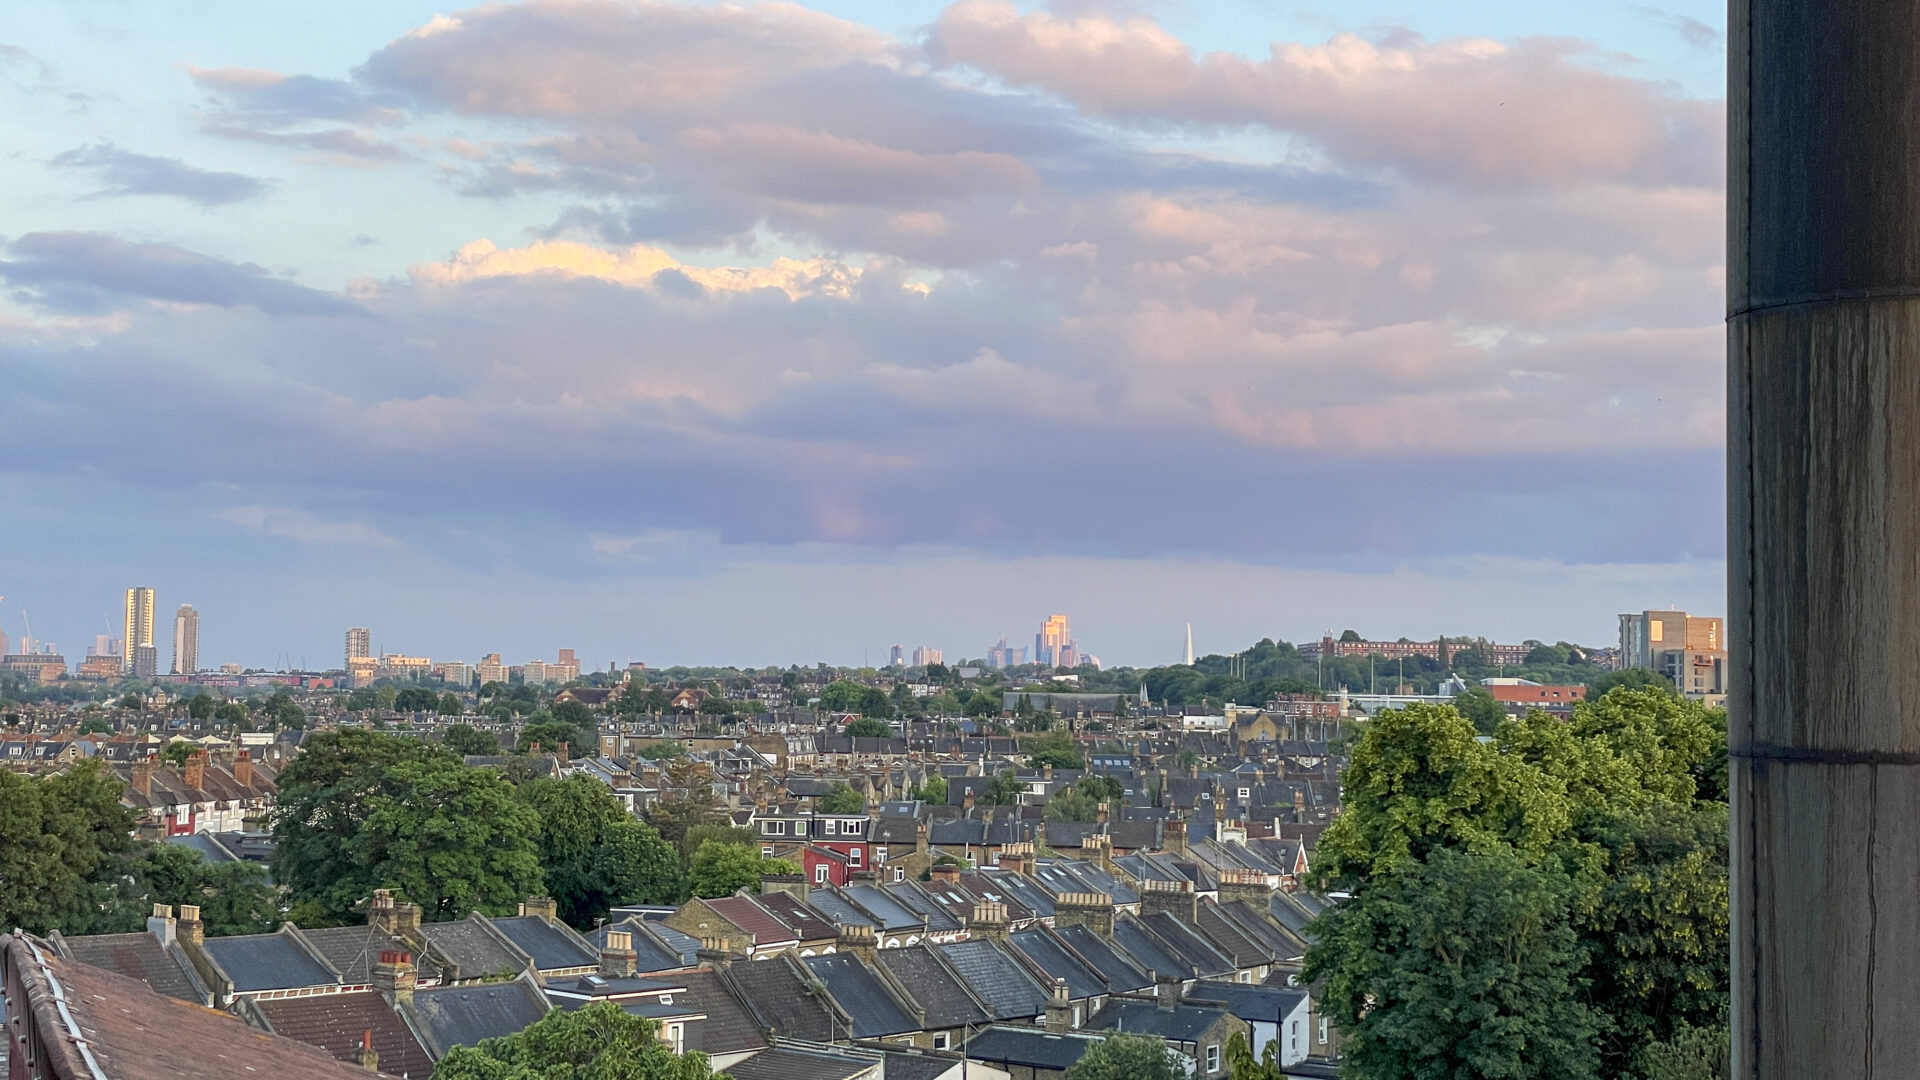
Hackney pairs inner-London culture with genuine connectivity. The median sold price is £600k (HM Land Registry, 12 months to March 2026) — firmly Zone 2, with more character than most Zone 2 alternatives.
Hackney scores 58/100 on the PAL Score — our weighted rating across six core criteria that define what makes a London neighbourhood work for buyers.
Score Breakdown
| Criterion | Score (/100) | What it means |
|---|---|---|
| School Quality | 65 | 28 schools within reach; notable proportion Outstanding or Good. Gayhurst, Shacklewell, and Queensbridge all rated Outstanding. Strong across primaries and secondaries. |
| Transport Connectivity | 77 | Overground to Liverpool Street in 15 minutes; no Underground station (nearest Bethnal Green 20-min walk). Limited night service (no night tube). |
| Property Price Affordability | 14 | Average flat £600k; terraced houses £1.24m. Carries 25–30% premium over comparable Walthamstow/Peckham/Stratford. |
| Green Space Access | 61 | London Fields (29 hectares with Lido), Victoria Park (86 hectares), Regent’s Canal towpath. Excellent green infrastructure for Zone 2. |
| Local Amenities | [score pending] | Broadway Market, Peckham Levels-style venue culture, independent food scene (Mangal 2, Brat, E5 Bakehouse). Genuine food and cultural destination. |
| Safety | 24 | Above London average for crime; stronger variation by street than by radius. Dalston and Kingsland Road busier; De Beauvoir Town and Clapton Square quieter. |
Scores use the PAL 0–100 scale based on z-score normalisation across all London neighbourhoods.
What This Means
Schools (65/100) and transport (77/100) are Hackney’s headline strengths. A 15-minute Overground journey to Liverpool Street is one of London’s fastest commutes for City workers. The school provision — 28 schools with high proportions of Outstanding ratings — is rare in Zone 2. London Fields Lido and Victoria Park (61/100) provide genuine breathing room.
The weakness is property affordability (14/100). At £600k for an average flat, Hackney carries a Zone 2 premium over comparable east London alternatives (Walthamstow, Stratford). The absence of a Tube station — Bethnal Green is a 20-minute walk — is a trade-off compared to Bethnal Green itself.
Hackney suits young professionals and creatives drawn to food and culture; young families prioritising schools and green space; and City workers valuing the Overground commute. If you need guaranteed late-night transport, a quieter neighbourhood, or lower prices, look at Walthamstow or Stratford instead.
Readers enjoying Hackney often look south next to Brixton, the Zone 2 creative capital that answers Dalston's Kingsland Road with Electric Avenue and Atlantic Road — the same flavour in a different postcode.
✓ Ideal For
✗ May Not Suit
💰 Value Assessment
Hackney is a Zone 2 premium market. The median sold price is £600k (HM Land Registry, 12 months to March 2026), with flats averaging £583k — clearly above most east London neighbours. Terraced houses at £1.24m average reflect Conservation Area scarcity, particularly near London Fields and Broadway Market. The premium is the price of the Central line, the food scene and the school cluster; for buyers comparing to Stratford, Walthamstow or Peckham, it is roughly a 10–25% step up for a comparable home.
🔮 Future Outlook
Hackney’s residential pipeline includes substantial development around Hackney Central and the Hackney Wick / Fish Island corridor over the next decade. Greater Anglia Weaver line upgrades and Elizabeth line interchange via Stratford continue to improve east-bound connectivity. The borough-wide ONS House Price Index shows Hackney down 3.7% in the year to February 2026, broadly in line with London’s 3.3% fall — this is a mature market where the dramatic gains belong to the 2010–2022 window and buyers are paying for location and lifestyle, not a discount.
Our Recommendation
Who's Hackney for?
This is your kind of place if:
- Work in the City. Liverpool Street in 15 minutes direct via Overground — one of London’s shortest Zone 2 commutes. Bank takes 29 via the Central Line.
- Value independent culture over chains. Broadway Market, Mare Street and Dalston are built on independent food, music and retail — rare in London at this density.
- Have young kids and prioritise schools. 11 Outstanding primaries within reach. London Fields, Victoria Park and the Hackney Marshes give serious outdoor space alongside.
- Want a Zone 2 flat with rental fallback. Hackney flats average £583k (Land Registry). One-bed rents £1,950/month (ONS, March 2026) — rental demand stays strong.
- Cycle commute or work hybrid. Hackney Central to Bank in 15–20 minutes via protected cycle lanes (Hackney Cycling Campaign). WFH culture is strong; daily Tube is optional.
- Want to live car-free. Hackney sits in the “no car” tier with Camden, Islington and Westminster — over 70% of households are car-free (Healthy Streets Scorecard).
Think twice if you:
- Need a Tube station on your doorstep. Hackney has no Underground — Bethnal Green is a 20-minute walk. Overground works but runs less frequently off-peak.
- Drive daily. The CPZ is tight, on-street bays are scarce, and many streets are too narrow for a second car. Permit costs and stress add up.
- Want a quiet, suburban feel. Hackney is one of London’s densest boroughs — 17,239 people per sq km. Mare Street and Broadway Market are busy at all hours.
- Commute west to Paddington or Heathrow. No direct line — getting to Paddington takes 35+ minutes with at least one Elizabeth Line or Tube change.
- Need very low crime stats. Hackney runs 52% above the London average — concentrated around Mare Street and Dalston, quieter in De Beauvoir or Clapton.
- Have a budget under £400k. You’ll be looking at ex-council flats or studio conversions, not the Victorian terraces that define Hackney’s residential character.
The Real Picture
Hackney is for people who choose density and culture over space and quiet. The Overground gets you into the City fast, the food and drink scene rivals anywhere in London, and the green spaces — London Fields, Victoria Park, the Marshes — keep it livable. But this is one of the densest boroughs in the country, no Tube on your doorstep, and Zone 2 prices that reward established residents while squeezing new ones. If being in the thick of London suits you, Hackney rewards the commitment. If you’d rather have space, suburbs or central-west connections, look elsewhere.
Moving to Hackney: The Practical Side
Removals and access
Many Hackney streets are narrow Victorian terraces with no off-street parking. Expect to pay for a council parking bay suspension on moving day (£35–£50 per bay per day, Hackney Council). Streets around Broadway Market and London Fields can be particularly tight for large vans — a 3.5-tonne vehicle is the practical maximum on most residential roads. Book early on Saturdays, when the market restricts vehicle access on Broadway Market itself from early morning.
Broadband and connectivity
Hackney has strong fibre coverage. Full-fibre (FTTP) broadband from Hyperoptic and Community Fibre is available across most of the borough, with speeds up to 1Gbps. Standard fibre (FTTC) from BT, Sky and TalkTalk delivers 60–80Mbps on average. Openreach’s full-fibre rollout is well advanced. [Verify current availability at your specific postcode via Ofcom’s broadband checker.]
GP registration and NHS services
The nearest major hospital with A&E is Homerton University Hospital on Homerton Row — a 10-minute bus ride from Hackney Central. GP provision is reasonable but some surgeries have closed lists. The City and Hackney GP Confederation coordinates across the borough. Register as soon as you exchange contracts — don’t leave it until moving day. Hackney Ark (Morning Lane) provides children’s health services including speech therapy and developmental assessments.
School admissions
Hackney Council runs a standard coordinated admissions round. Apply by 15 January for primary reception (September start) and 31 October for secondary. In-year transfers are handled directly by the council’s School Admissions team. For popular primaries like Gayhurst and Queensbridge, check last-distance-offered data carefully — catchments can tighten significantly in oversubscribed years.
Council tax transfer
If you’re moving from another borough, your council tax account doesn’t follow you — you’ll need to register with Hackney separately. Do this within the first week. Single-person households get a 25% discount (apply at hackney.gov.uk/council-tax). Direct debit can start from any month, and you can choose 10 or 12 monthly payments.
Frequently Asked Questions
Common questions about living in Hackney, answered with data from our research.
When asking is Hackney safe, it’s important to assess your specific circumstances. Hackney’s crime rate is above the London average, as you’d expect for an inner-city borough. The well-lit main roads — Mare Street, Kingsland Road — feel busy and peopled until late. Side streets are quieter. Resident forums consistently advise “common sense precautions” after dark, particularly around Dalston on weekend evenings. The Safer Neighbourhood Team has dedicated ward officers across Hackney Central, Dalston and Hackney Downs (Metropolitan Police, 2025).
The streets bordering London Fields — Lansdowne Drive, Middleton Road, Mentmore Terrace — combine Victorian terraces with direct park access and proximity to Gayhurst Community School. Further north, the Clapton Square Conservation Area offers larger properties on quieter streets with Hackney Downs park and Shacklewell Primary nearby. De Beauvoir Town (bordering Islington) is popular with families for its village feel and low-traffic streets.
The short answer: it already has. Broadway Market’s transformation from a struggling market to a weekend destination happened over a decade ago. The current shift is more incremental — ex-industrial spaces in Hackney Wick converting to studios and flats, new developments along the canal corridor, and average flat prices now sitting at £550,000 (Land Registry, 2025), reflecting how much Hackney property prices have risen over the past 10 years. Long-standing communities remain, but the affordability picture has changed fundamentally.
Strong. Full-fibre (FTTP) coverage is widespread, with Hyperoptic and Community Fibre offering up to 1Gbps in many buildings. Standard fibre averages 60–80Mbps. New-build flats typically have fibre pre-installed. Check your specific postcode at Ofcom’s broadband availability checker before committing.
Dalston is part of Hackney — it’s one of the borough’s distinct neighbourhoods. The area around Dalston Junction and Kingsland Road has the nightlife, the Turkish restaurants, and the late-night bars. Hackney Central, half a mile south, is quieter after dark, more family-oriented, and centres on Broadway Market and London Fields. Same borough, quite different feel street by street.
Yes, if you mean kerb availability. The CPZ covers almost every residential street, and demand exceeds supply around Mare Street and Dalston. But resident permits are only £98/year (Hackney Council, 2025/26), which is cheap for Zone 2. Visitor vouchers are limited. If you have a car, you’ll keep it — but you’ll walk to it rather than park outside your door.
A mix of both. Ridley Road Market (open daily, busiest Saturdays) sells fruit, vegetables, meat and fish at well below supermarket prices — it’s one of east London’s last proper street markets. For supermarkets, there’s a large Tesco on Morning Lane, a Lidl on Kingsland Road, and Sainsbury’s Local and Tesco Express branches scattered along Mare Street. Broadway Market’s stalls and independent delis handle the artisan end.
Hackney is excellent for dogs. London Fields has a large, popular off-lead area. Victoria Park (1.2 miles east) has dedicated dog-walking routes and open parkland. The Regent’s Canal towpath gives you a flat, traffic-free walking route stretching miles in either direction. Hackney Marshes is wide-open green space with room to run. Most Broadway Market cafés are dog-friendly.
Homerton University Hospital, Homerton Row, E9 6SR — roughly 10 minutes by bus from Hackney Central. It has a 24-hour A&E department. The Royal London Hospital in Whitechapel is the nearest major trauma centre, about 15 minutes by bus or cab.
Rush hour (7:30–9am): the Overground from Hackney Central to Liverpool Street runs every 5–7 minutes but is standing-room-only. The 15-minute journey time doesn’t change much, but the experience does. Off-peak, trains run every 10–15 minutes with seats usually available. Cycling to the City (18 minutes) avoids the congestion entirely and is the preferred commute for a significant portion of residents.
Data from HM Land Registry, Ofsted, Metropolitan Police & TfL. Last updated 15 May 2026.
Moving to Hackney?
Get our free moving checklist and local tips delivered to your inbox.
No spam. Unsubscribe anytime.